Saudi Exports Drop 4.5% In June As Non-Oil Exports Decline
Non-oil exports fell 9.7% while oil exports slipped 2.3%, narrowing the trade surplus by 10%.
Tariq Benali Tariq Benali covers business and corporate news across the UAE and MENA for Anecdoted, tracking the deals, leadership moves and regulatory shifts behind the region's companies. tariq@anecdoted.com
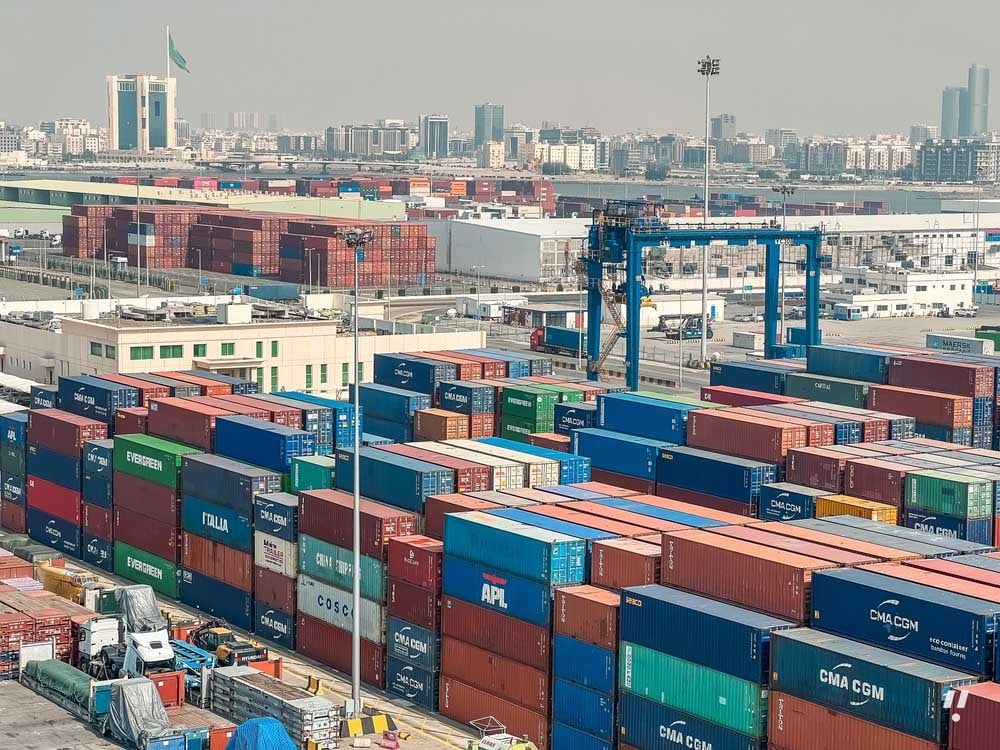
Saudi Arabia’s merchandise exports fell 4.5% in June 2026 compared with the same month a year earlier, according to data released by the General Authority for Statistics (GASTAT). The decline was not uniform. Oil exports slipped 2.3%, while non-oil exports including re-exports dropped by a sharper 9.7%. Once re-exports were stripped out, the non-oil picture looked worse still: national non-oil exports were down 11.4%.
Re-exports proved an additional drag. Their total value decreased 6.7%, hammered by a 41.7% collapse in machinery, electrical equipment and parts. That category had accounted for 36.1% of all re-exports.
Balance and composition
Imports also contracted in June, easing 3%. The merchandise trade surplus narrowed by 10% as a result. Oil’s share of exports moved higher anyway, to 72% from 70.4% a year earlier. The rise was not driven by stronger crude shipments but by a smaller fall in oil exports than in non-oil exports. The ratio of non-oil exports, including re-exports, to imports fell from 37.5% to 34.9%.
Largest traded goods
Plastic, rubber and their articles stayed the largest non-oil export category, holding 20.7% of the total. Their value declined 12.8% year on year. Chemical products and allied industries accounted for 19.2% of non-oil exports, but their value fell 30.4% — the steepest drop among the large categories. Together, the two categories made up nearly 40% of total non-oil exports.
Import composition differed. Machinery, electrical equipment and parts represented 25.7% of the import bill, down 20.4%. Chemical products rose 30.5%, lifting their share to 11.2%.
Main partners
Japan received 13.2% of Saudi merchandise exports in June, making it the kingdom's largest market. South Korea ranked second, with an 11.5% share, and China third at 9.4%. India, the UAE, Poland, Egypt, Malta, Taiwan and Singapore filled out the top ten, which together took 67.1% of all exports.
China remained the biggest source of Saudi imports, supplying 22% of the total. Switzerland was second at 8.4%, and the United States third at 8.3%. The other seven positions went to India, the UAE, Germany, Egypt, Italy, France and Japan. These ten countries provided 65.2% of imported goods.
Trade hubs
Jeddah Islamic Port was the most active hub, handling 37.2% of imports and 31.9% of non-oil exports. Four other gateways processed large import flows: King Khalid International Airport in Riyadh at 17.2%, King Abdulaziz International Airport in Jeddah at 12.6%, King Fahad International Airport in Dammam at 5.5%, and Al-Batha Port at 4.4%.
Non-oil exports were less concentrated but still funneled through a handful of hubs. King Khalid handled 9.9%, King Abdulaziz 9.5%, Al-Batha 9.3%, and Al Hadithah Port 3.9%. Combined with Jeddah, the five hubs accounted for 64.5% of all non-oil merchandise exports.

%22%3E%3Crect%20x%3D%22-10%22%20y%3D%224%22%20width%3D%22120%22%20height%3D%221%22%20fill%3D%22%2300ff89%22%20opacity%3D%220.9%22%2F%3E%3C%2Fg%3E%3Ccircle%20cx%3D%22106%22%20cy%3D%2285%22%20r%3D%224.230769230769231%22%20fill%3D%22%2300ff89%22%20opacity%3D%220.75%22%2F%3E%3C%2Fsvg%3E)